Case Study: Reimagining Urban Intersections
Introduction
With a fellow computational design researcher, Atefeh Mahdavi Goloujeh, I co-hosted a design workshop titled Reimagining Urban Intersections through Systems Thinking. Our workshop used traffic intersections as a site for potential design interventions, and introduced an open-source software, Loopy,1 to simulate factors influencing intersections as a system. We found that, in addition to being an effective tool to model emergent behavior in a system, Loopy serves to clarify and make explicit biases and assumptions of the designer. When used by a group of designers, this forms the basis of a conversation among the designers as well as between the designers and the simulation itself.
Participants
Participants are all attendees to the Computational Design: Practices, Histories, Infrastructures symposium, held at Carnegie Mellon University in October, 2017. The three participants in our workshop are students (two undergraduate, one graduate) enrolled in design or architecture programs. All three identify as female, and are in their early- to mid-20s. Per the results of a survey distributed before the workshop, all three typically walk or take the bus to navigate their respective cities (this likely stems from their status as transient students, and may also be a factor self-selection toward this workshop in particular). When asked to name their most memorable experience at an intersection, all three gave negative responses, such as nearly being struck by a vehicle and “hat[ing]” a particular intersection in their hometown. With this question, we hoped to begin priming participants to think about negative events whose motivating factors they might model in a simulation.
Activity 1: Negotiating an Intersection
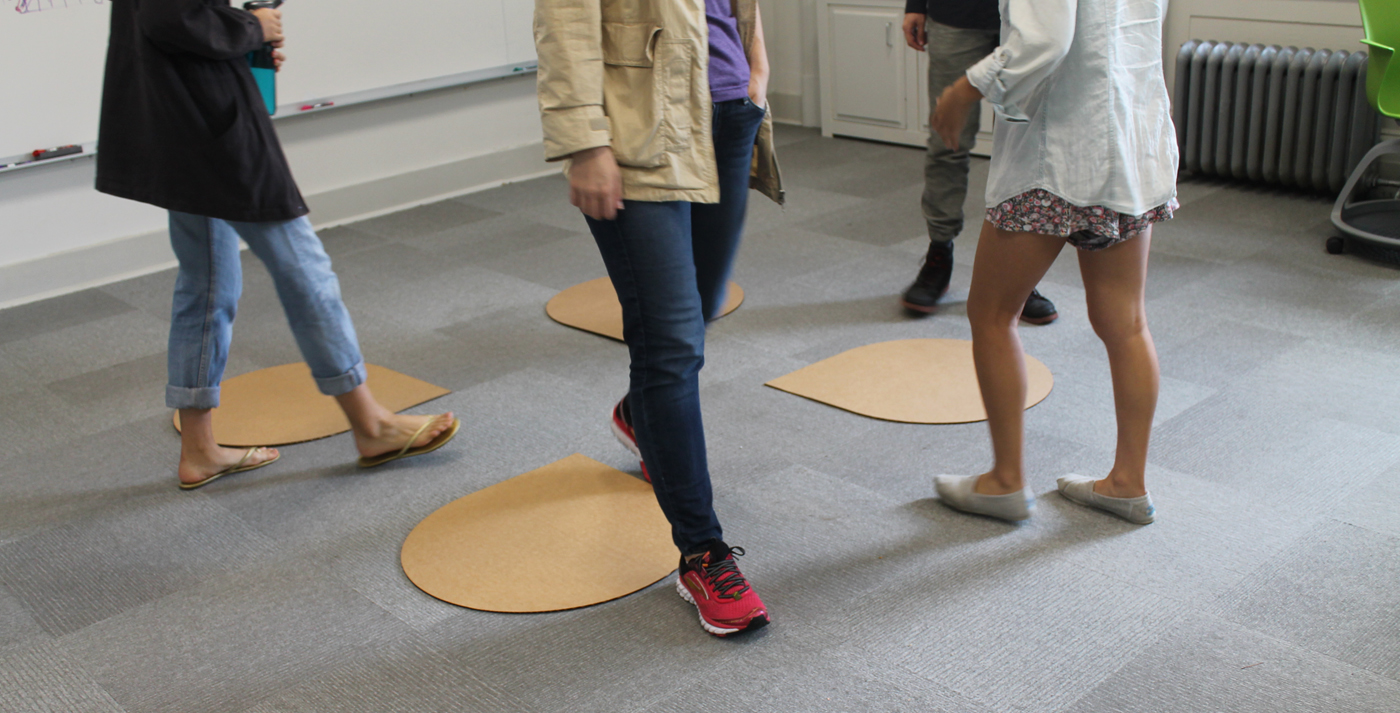
We began the workshop with a physical activity, both an icebreaker and a means to encourage different ways of thinking about intersections. We laid four cardboard ‘teardrop’ shapes, about 2 feet in diameter, on the floor, to suggest a cloverleaf interchange with the negative space.
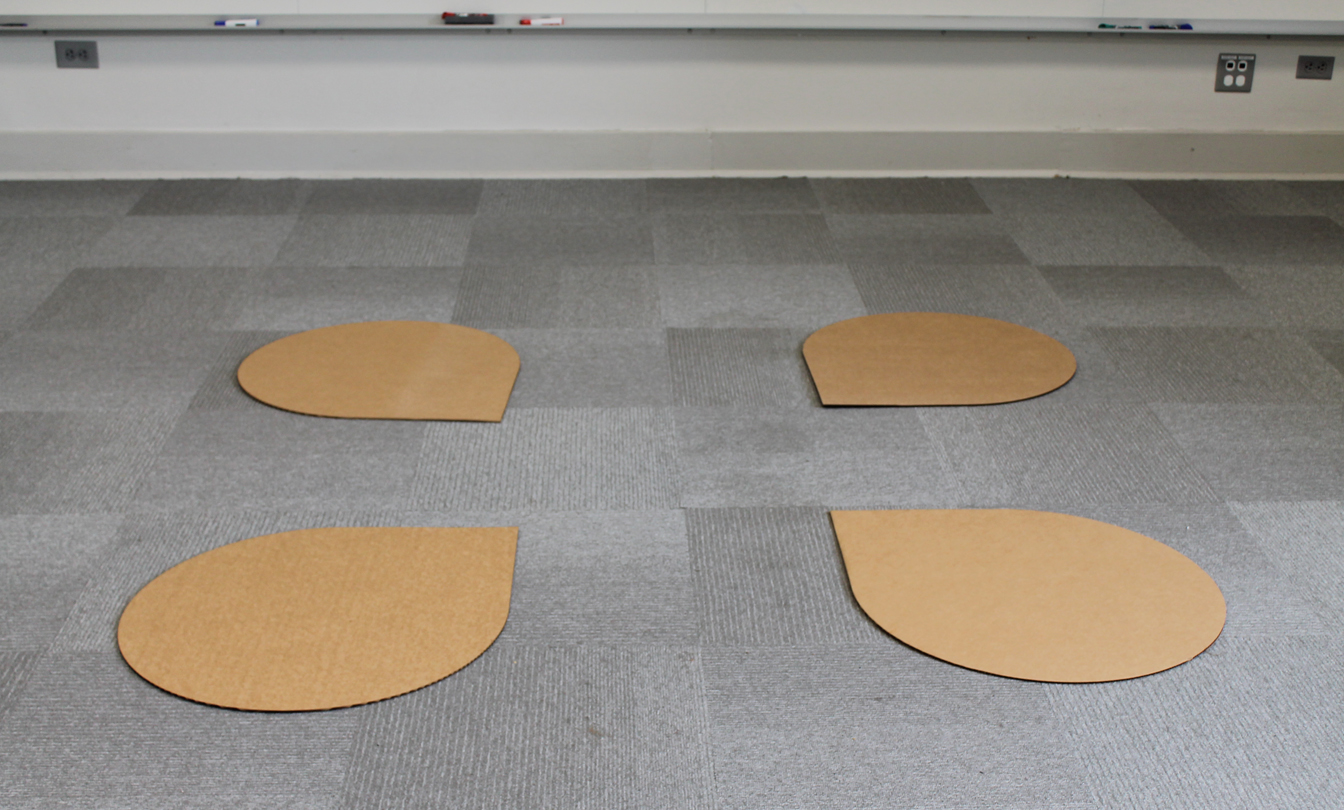
Then, in a physical simulation with human bodies representing vehicular traffic, we asked the participants to begin walking through and around the intersection. The rules for agents in this simulation were that they should strive for continuous (not necessarily fast) motion and that they could not communicate with each other with speech. After about one minute of this, we brought the cardboard shapes closer together on the floor to ‘tighten’ the intersection. After another minute, we declared that one path would become ‘one-way,’ allowing movement in one direction but not the other. Finally, co-investigator Mahdavi Goloujeh and I stepped onto the cardboard, and acted as ‘pedestrians’ to the participants’ ‘drivers,’ stepping in front of their paths between the cardboard shapes. Through this activity, participants began thinking about how individual behaviors, the environment, and rules form the possibility space within which a typical traffic intersection exists.
Activity 2: Generating Factors and Affinity Diagramming
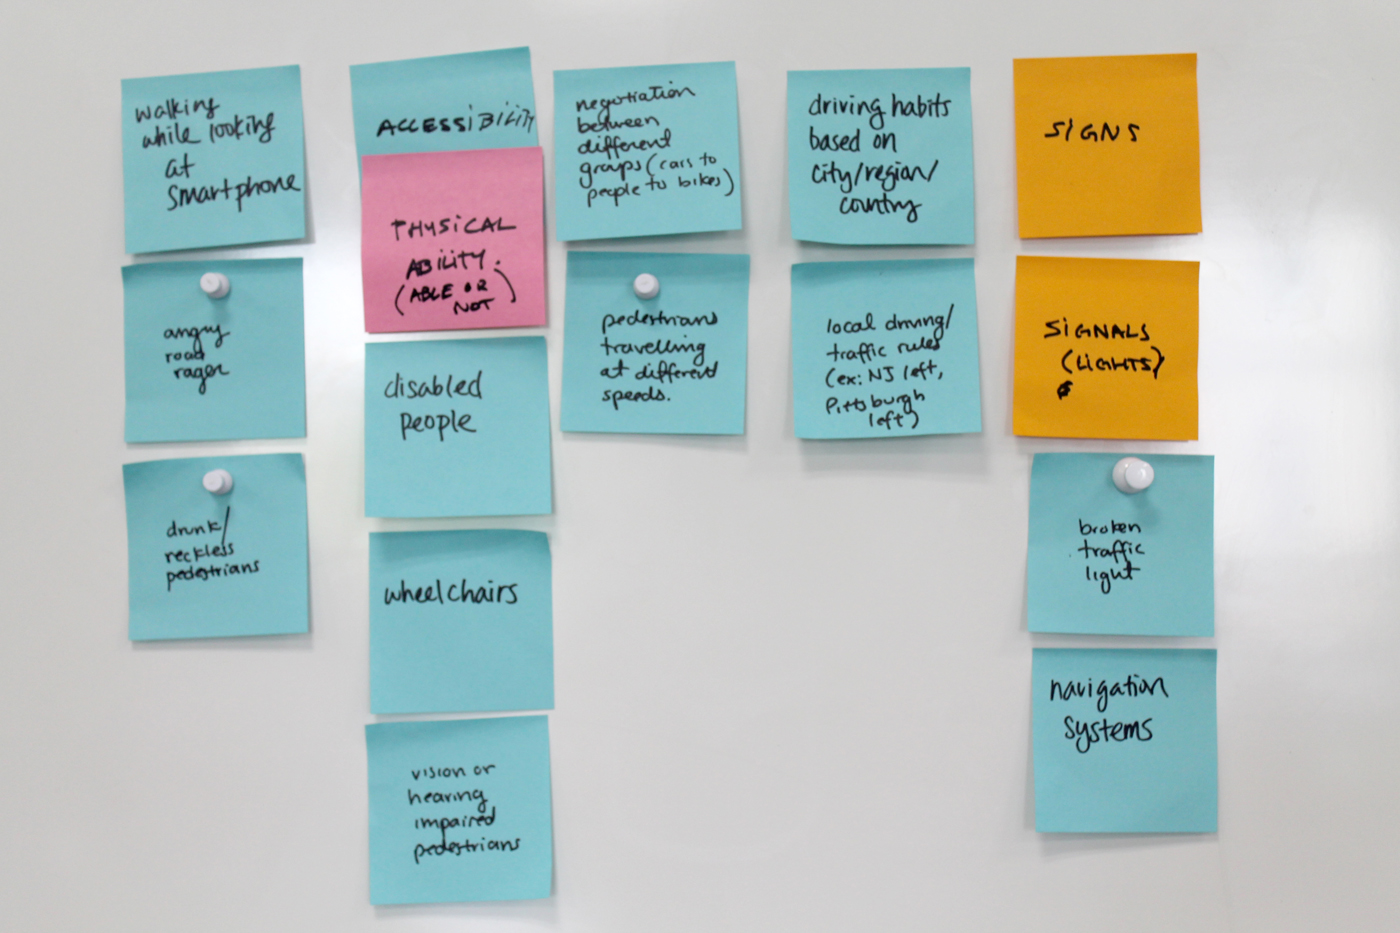
Then, we provided some examples of real-world factors influencing intersections — amount and types of traffic lights, the presence of sensors on cars providing drivers with feedback, and a regional phenomenon known as the ‘Pittsburgh left’ — and we asked the participants to spend five minutes listing on Post-It notes as many other intersection factors they could think of.
After this, we asked the participants to bring their factors to a large whiteboard and look at all the factors. We asked them to move the Post-It notes around on the whiteboard to group similar factors into an affinity diagram, meant to draw out patterns of thinking. This led to a discussion about the different types of factors they had come up with, noting the common themes that had arisen, and their perspectives on these factors. After about 15 minutes of conversation, we asked the participants to identify five factors that they wished to focus on for the coming activities.
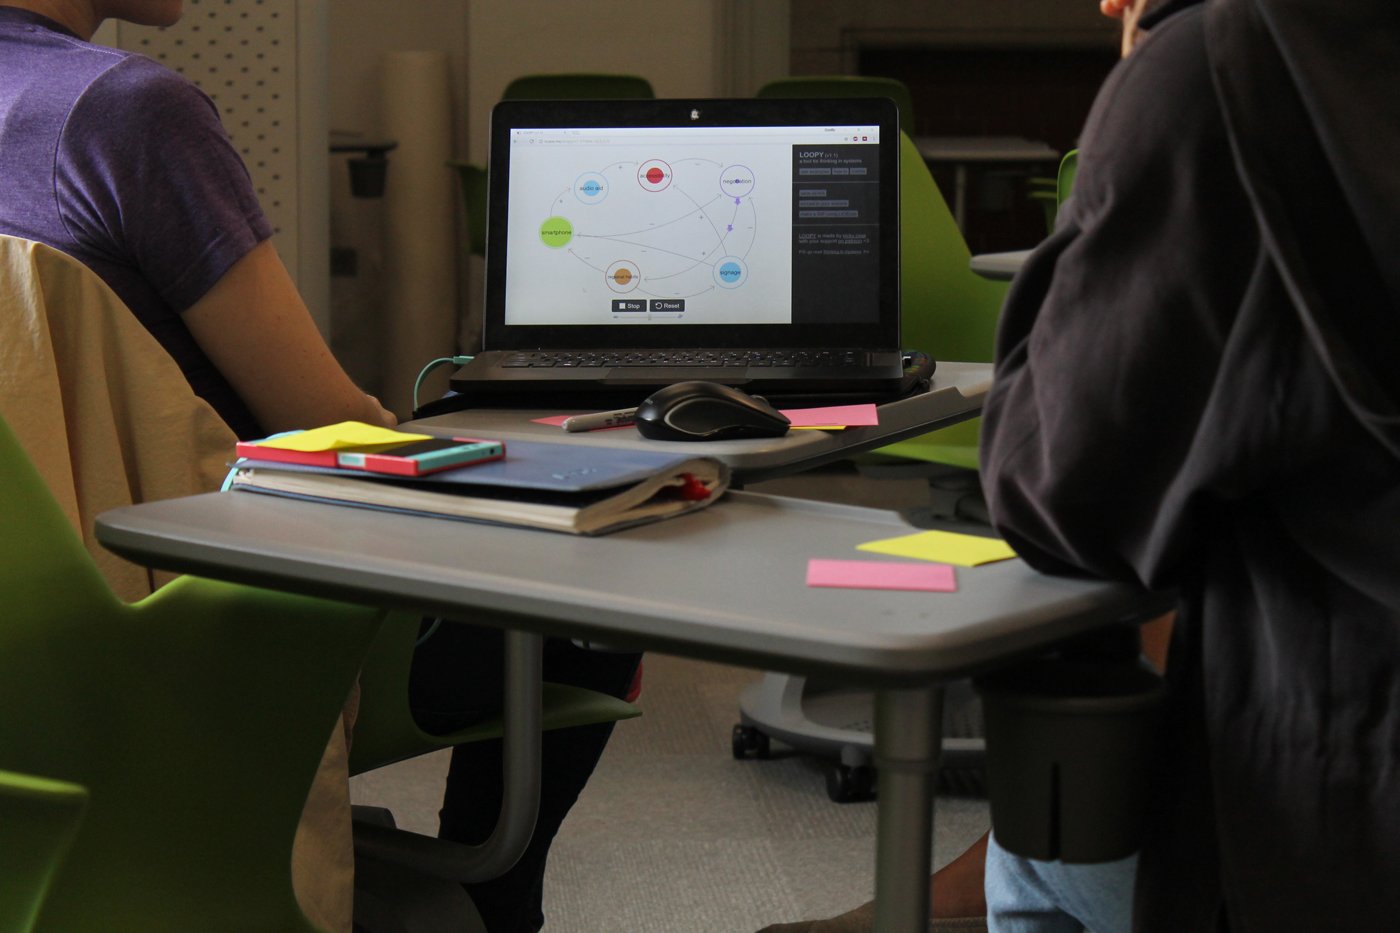
Activity 3: Loopy
We introduced Loopy as another type of simulation which models the high-level relationships between various system factors. Loopy is not a tool to model specific types of systems, such as ecological or economic, but systems in general, as relationships of and flows between entities. In Loopy, a designer-user draws circles which represent factors, and then draws arrows between them to represent the interaction between these factors: For example, in a basic ecological simulation, one might include ‘predators’ and ‘prey’ as the two factors. Two arrows would be drawn: A positive relationship from prey to predators (more prey leads to more predators), and a negative relationship from predators to prey (more predators leads to less prey).
For the intersection simulation, we encouraged the participants to think of their factors not necessarily in strictly quantitative terms, but also qualitative — a positive relationship might mean that factor A leads to ‘better’ or ‘stronger’ factor B (as opposed to more of it). The factors that the participants chose to simulate were:
- Pedestrian attention/distraction (articulated through ‘smartphones’)
- Accessibility (for both cars and pedestrians)
- Negotiation between drivers and pedestrians
- Regional habits
- Signage
The participants began by drawing circles for each of these factors, and then drawing arrows to model the relationships between the factors. For example, in their telling, smartphones have a negative relationship to negotiation between drivers and pedestrians — more smartphones results in less negotiation/communication. After setting up the relationships between factors, the participants ‘ran’ a simulation by making a change to the system: Increasing the number of smartphones in use. They then observed the resulting, proliferating changes to the system. They found some of the results unrealistic, and changed some of the relationships in order to run the simulation again and observe these changes in action.
Eventually, they added a sixth factor, ‘safety,’ to serve as a yardstick by which to measure their simulations. After iterating on the simulation a few more times, they moved on to the final activity, proposing potential design interventions that could shift their modeled system in desirable directions.
Activity 4: Design Interventions
Finally, the participants used the whiteboards to propose some design interventions based on their system simulation. They first rewrote their initial factors on the board, and one of the participants drew a storyboard for an embedded sign meant to address smartphone users. They also sketched an intersection with smartphone-linked signage. The last design intervention was a system of signs aimed at cars approaching intersections that would state the number of pedestrians at the coming intersection.
Findings
From observing the participants using Loopy to model factors of urban intersections in a system, we draw three overall conclusions. First, Loopy is an effective tool to simulate the unexpected consequences of changes in a system (that is, to simulate emergent behavior). Second, Loopy is most useful when viewed as a dialogue between the software and a designer or, preferably, a group of designers. Finally, Loopy helps designers to clarify and make explicit certain assumptions they hold, but it also obfuscates other biases.
Throughout the activity, the phenomenon (and observation) of emergent behavior played a significant role in the participants’ usage of the tool. Loopy requires the designer to make some change to the system in order to begin a simulation run. On the first iteration, the participants increased ‘smartphones.’ This soon led to an undesirable scenario, best told in the words of Participant 1: “Oh, no! No signage and no accessibility!” Later, after noting the increased levels of ‘smartphones’ and ‘regional habits,’ she described the effects as “…a bunch of people on their smartphones doing the Pittsburgh left.”2 All the participants noted how a small change in one area of the system could have ripple effects that defied their expectations qualitatively and quantitatively. The concept of emergent patterns resulting from interactions at other levels in a simulation seemed to be reinforced through Loopy.
The participants were engaging in a back-and-forth dialogue with Loopy, using it as a discursive tool rather than a means to analyze or quantify behavior. Throughout the duration of the simulation activity, they ran at least eight iterations on their initial system design. From the second to third iteration, they didn’t change any factor or relationship of the system, but initially increased ‘signage’ instead of ‘smartphones,’ and noted that the resulting scenario was preferable, with high levels of ‘accessibility.’ Participant 3 observed: “Oh, this is so much better.” Looking back on this iteration a few minutes later, Participant 1 wondered, “Is there a way to max out smartphones that also increases accessibility?” Observing unexpected emergent behavior led the participants to trace certain effects, analyze their model, and make adjustments. As Participant 1 put it after a later iteration: “I guess deleting that link between smartphones and signage had a huge impact. Our design intervention is not working as well.” Loopy is far from ‘black box’ software, which provides an output for an input without revealing its functionality. Instead, it allows designers to peer into causal relationships within their simulation, and encourages self-conscious iteration on their work.
Through discussion of how to model factors and relationships, designers working collaboratively must articulate certain assumptions they hold. However, Loopy also appears to reinforce other biases, and hides the effects of any un-modeled factors or relationships. Early in the activity, as they were beginning to draw relationships between factors, Participant 2 justified one link by saying: “Perhaps more signage would lead to less smartphone [usage], because people are like, ‘Aw [expletive], I gotta look.’” Had the participants been provided with datasets related to the system factors, this would have provided fodder for the simulation. However, in this workshop, the participants’ beliefs about how and why intersections function provided justification for their system model, and they had to communicate these to each other. Later in the activity, however, the simulation appeared to take on more and more agency, and conversation around the faithfulness of their model to reality took a backseat to creating desirable scenarios. In later iterations, working at a faster pace, the participants forgot what exactly they had changed from one iteration to the next and for what reasons. Conversely, they also increasingly began to see the factors they had modeled as comprehensive — an example of behavioral economics researcher Daniel Kahneman’s phenomenon of ‘What You See Is All There Is,’3 and a negative version of Turkle’s “immersion” in simulations. A particular challenge for designers working with Loopy or other simulation software is to remain engaged but skeptical throughout the process.
Future Work
Mahdavi Goloujeh and I plan to hold further versions of this workshop to address some issues we noted. First, we would like to conduct a workshop with a group of non-designers and non-students to discover how people who have not been exposed to systems thinking (as all of our participants had been) would use a tool such as Loopy. In the future, we will also encourage the participants to choose five specific factors to model in the simulation, as opposed to general factors such as ‘accessibility’ — this should be broken down into concrete examples, among which one could be chosen to stand in for the whole. However, we are intrigued by the participants’ introduction of a new generic factor, ‘safety,’ to serve as the ultimate goal of their system, and wonder how future participants might assess their simulations. To discourage the participants from making arbitrary changes to their system based on such a goal, we might ask them to track all their changes in a related document, and to justify them with stated assumptions.
We believe that Loopy is an effective tool for performing high-level, qualitative modeling of systems and their behavior. For designers, it is especially useful as a discursive tool when used collaboratively, encouraging designers to make explicit their assumptions about systemic factors and their relationships. It also allows designers to model certain interventions into the system, such as (in this workshop) increased signage or smartphone usage. There are drawbacks to Loopy, which are likely common to any simulation software, such as designers ignoring possible factors that have not been modeled. This might be addressed through prompts in the software that ask the designers to consider what other effects or what other factors might exist in this system, or (to compensate for increasing system complexity) to include a separate area for listing unmodeled but relevant factors.
1. Case, Nicky. Loopy, http://ncase.me/loopy/, accessed September 21, 2017. ↩
2. Typically, in U.S. American cities, a driver at a red light who is turning left, when the light turns green, will wait for others passing straight through before turning. In Pittsburgh, the first driver at a red light turning left takes precedence over others passing straight through (although a second or third driver turning left will wait). While there appears to be little literature on the Pittsburgh left, it is a well-recognized, if illegal, local behavior. ↩
3. Kahneman, Daniel. Thinking, fast and slow. Macmillan, 2011. ↩